
When collections fall, the net collection rate is often one of the first numbers a practice owner asks to see. It can help explain how much of the revenue available for collection is reaching the practice. It cannot, on its own, establish why cash changed, whether each payer paid correctly or whether the billing team has completed the right follow-up.
The most useful review begins by agreeing on how the number was calculated. Only then can leadership decide what it means and which additional questions need an answer.
How to calculate net collection rate
Net collection rate = payments after credits ÷ (charges − approved contractual reductions) × 100.
For the adjusted collection-rate approach described by the AAFP, divide payments after credits by charges after approved contractual reductions, then multiply by 100. The AAFP recommends a 12-month calculation window. Confirm how your reporting system defines the numerator, denominator and dates before comparing its net collection rate with another report. Read the AAFP's calculation guidance.
In a simplified fictional example, a practice reports $200,000 in charges, $80,000 in approved contractual reductions and $116,400 in payments after credits for its selected reporting period. The calculation is $116,400 divided by $120,000, or 97%. This is an arithmetic illustration, not a recommended benchmark or a finding about a real practice.
Net collection rate versus gross collection rate
Gross collection rate compares payments with charges before contractual reductions. Net collection rate adjusts the charge denominator for approved contractual reductions. In the same fictional example, the gross rate is $116,400 divided by $200,000, or 58.2%; the net rate is 97%. The difference reflects the denominator, not additional cash received. Compare like definitions, time periods and adjustment categories before drawing conclusions.
Check what the adjustment categories are doing
The same fictional example shows why classification deserves attention. If another $6,000 were incorrectly removed from the denominator as a contractual reduction, it would fall to $114,000. The reported rate would rise to approximately 102.1%, even though payments remained $116,400.
The arithmetic improved because the amount being measured against collections changed. Leadership would need to review the adjustment detail before interpreting the higher percentage as better performance. A rate above 100% can also result from reporting-period timing; the number alone does not establish the cause.
A practical review asks which adjustments reduced the denominator, who approved the categories and whether those definitions stayed consistent between periods. Keep contractual reductions distinguishable from other write-offs so the report can support an informed discussion.
Separate cash timing from collection performance
A monthly collections report and a report of charges posted in the same month may describe different groups of services. Payments received this month can relate to earlier work, while recently submitted claims may still be moving through payment processing. A change in service volume or payment timing can therefore affect the relationship between the two totals.
A longer reporting window can provide context, but leadership still needs to understand the dates in each report. If the question concerns a specific payer or service period, examine the related claims and payments together and state how much time has elapsed for collection. Keep that analysis distinct from a simple comparison of calendar-month totals.
Ask what the overall percentage leaves unexplained
An overall collection rate combines information that may look very different by payer. One payer's improvement can offset another payer's deterioration in the total. A service mix change can also alter the practice's financial experience without identifying a failure by the billing team.
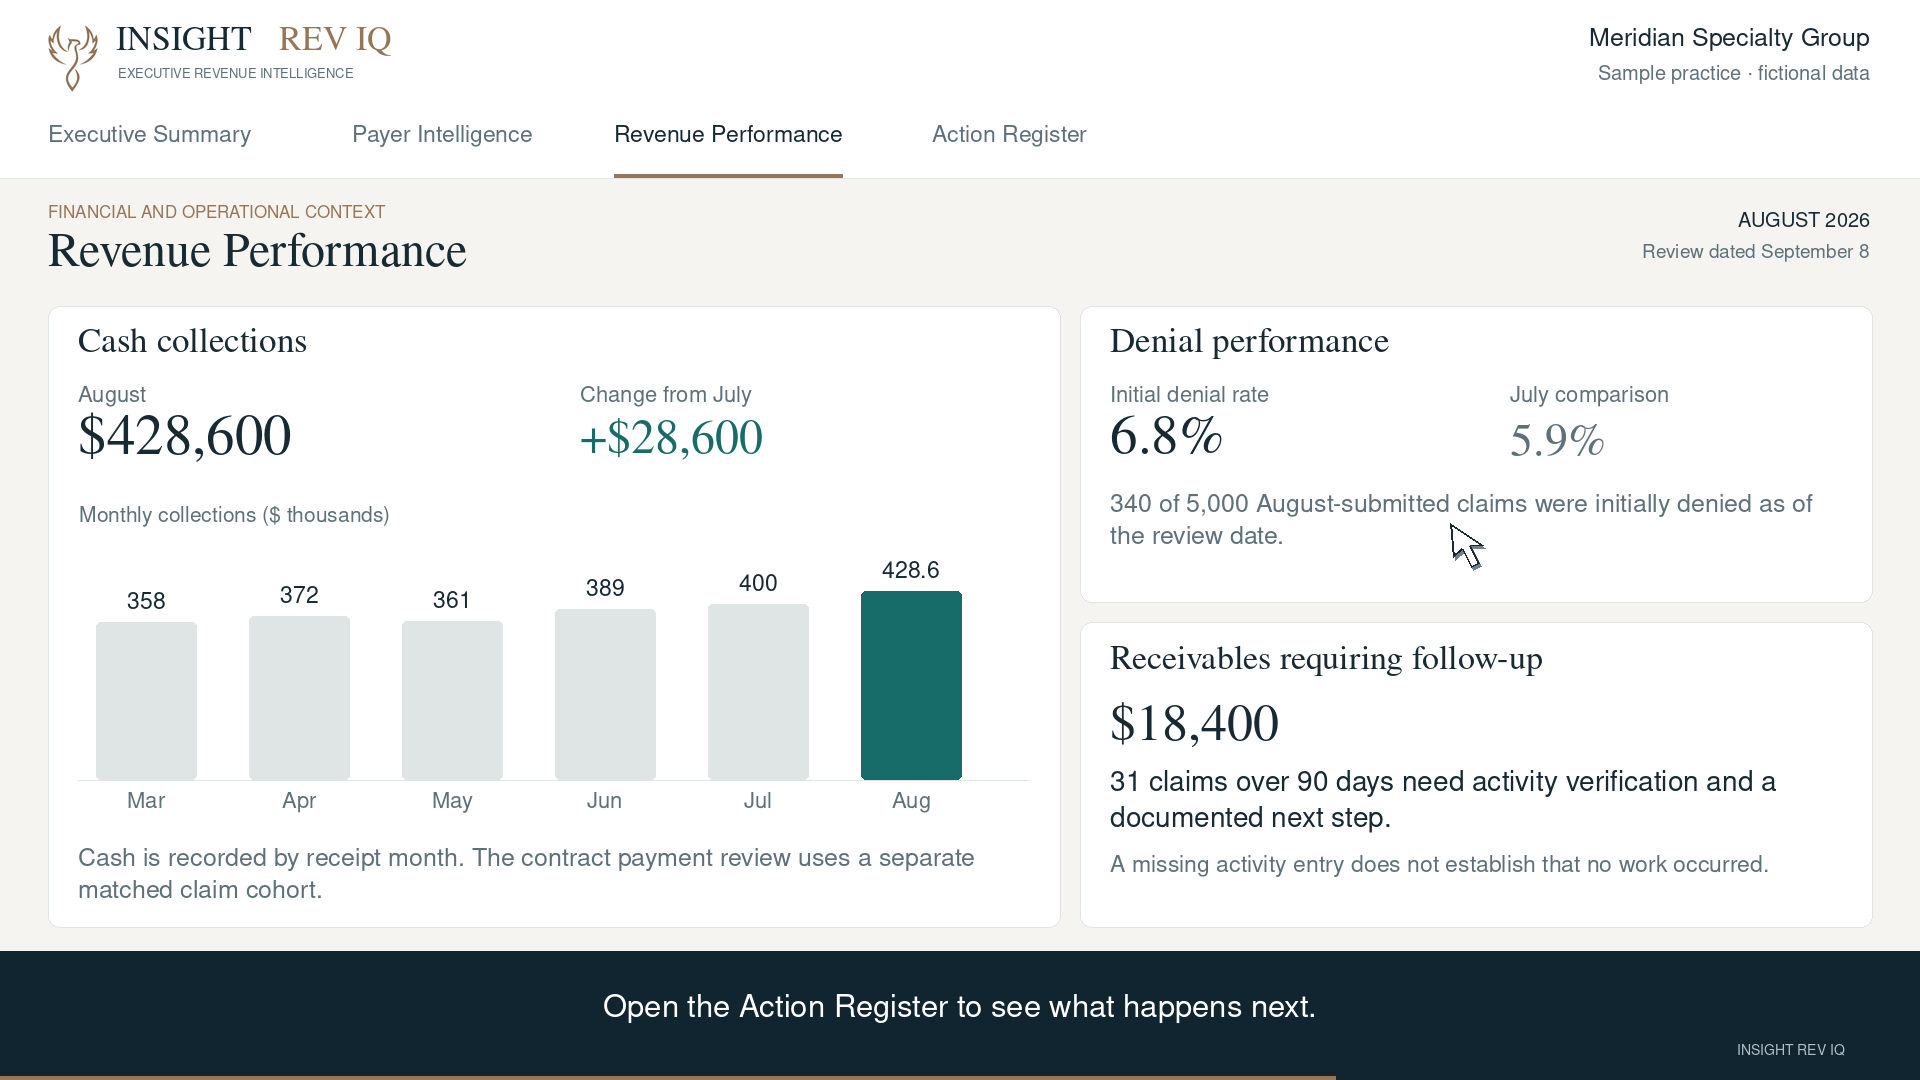
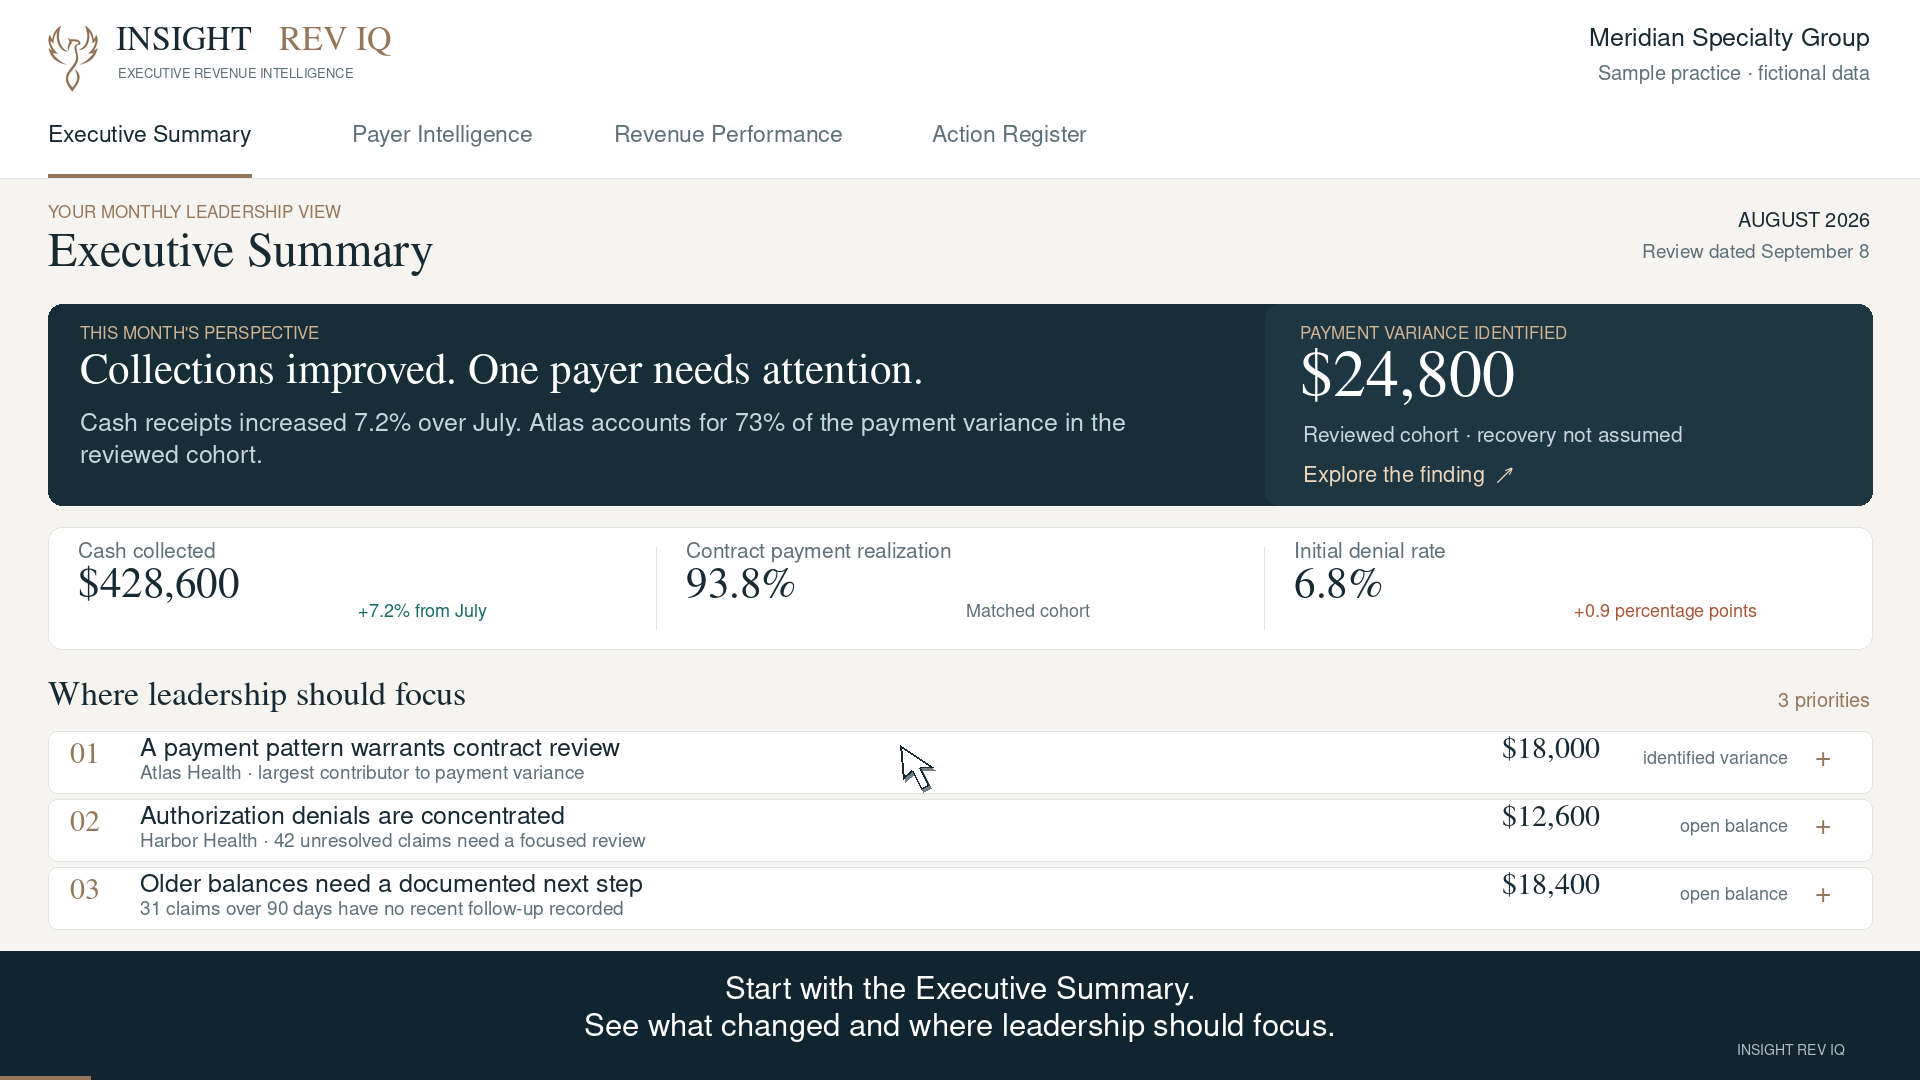
In the fictional Rev IQ dashboard, the payer view compares expected and actual payments for 400 matched claims. The 93.8% payment realization shown there is a measure for that defined sample. It should not be relabeled as the practice's net collection rate. It answers a different question about a specific set of payments.
That distinction is central to useful executive reporting. Every metric should state what it measures, the records included, the relevant dates and the limitations that affect interpretation.
Bring the supporting measures into the leadership review
Review the collection rate alongside aging balances, denial patterns, payer payment timing and reimbursement differences. Then connect each concern with the underlying records. If older receivables increased, which balances account for the change? If denials rose, which categories and payers drove it? If a payment discrepancy appeared, has the applicable contract expectation been verified?
The same discipline applies to evaluating billing performance. Ask for evidence of follow-up, unresolved barriers and the next action. A weak metric is a reason to investigate. Responsibility becomes clearer when the team can distinguish a payer issue, a data problem, an internal workflow gap or another cause supported by the records.
Turn the review into a decision and a follow-up date
For each material finding, document what changed, the explanation supported by the evidence, what remains uncertain, the action owner and when leadership will review progress. A finding that returns month after month without an updated status needs an explanation of what is preventing the next step.
Insight Rev IQ's Executive Revenue Intelligence service brings revenue cycle analytics together with human interpretation, an updated executive scorecard and action-owner follow-up. The objective is to give physician owners and practice managers enough context to decide where attention belongs and to measure what happens next.
Watch the executive walkthrough to see the relationship between the executive summary, payer detail and action register. To identify the questions most relevant to your practice, start the brief Revenue Performance Insight Review.
Continue with the monthly revenue scorecard for physician owners, or explore the Knowledge Center.
-min.webp)


.svg)
