
A higher contracted reimbursement rate can look attractive on paper. The leadership question is what the practice actually receives, how long payment takes, and how much work is required to obtain it.
A payer report card puts those factors together. It helps physician owners identify where a favorable rate translates into value and where payment friction deserves closer attention.
Start with comparable services
Do not rank payers solely by average payment per claim. Different service mixes, units, locations, providers, and patient responsibilities can produce differences that have little to do with the agreement itself.
Define a comparable group of services and the applicable contract versions. State the service dates, the time allowed for payment, and the records included. If the comparison cannot reasonably control for a material difference, explain that limitation instead of presenting a simple ranking.
Separate the allowed amount from the payer's responsibility and the patient's share. A comparison of payer payments alone can be misleading when benefit design changes the allocation.
Show expected payment and realized payment separately
For matched records, establish the reimbursement expectation and reconcile payments, reversals, and applicable adjustments. Label unexplained differences as potential variances until they have been validated.
A lower realized amount may reflect timing, missing records, patient responsibility, or a payment error. The report card should help determine which explanation the evidence supports. Our guide to identifying payer underpayments explains the validation process.
Make administrative effort visible
Consider the work generated by the payer: additional documentation, corrected claims, denial follow-up, appeals, and repeated status checks. Use measured time where available. If staff time is estimated, identify the method and avoid presenting the result as precise accounting.
Apply a consistent labor-cost assumption to comparable activities. Include vendor fees only where they can be reasonably allocated. Avoid counting the same activity twice or treating ordinary clinical costs as collection costs.
The resulting view is a decision aid. It is not a complete profitability calculation.
A fictional comparison
Imagine two matched groups of 1,000 comparable claims. All figures below are hypothetical and are not client results or benchmarks.
- Payer A: $130,000 in reconciled receipts attributable to the claims and $8,000 in measured collection-related administrative cost.
- Payer B: $126,000 in reconciled receipts attributable to the claims and $3,000 in measured collection-related administrative cost.
Subtracting only those administrative costs leaves $122,000 for A and $123,000 for B. In this simplified comparison, B leaves $1,000 more after the specified collection costs despite lower receipts.
This does not mean B is the more profitable payer overall. The example excludes clinical delivery costs and other overhead, assumes comparable claim groups and payment maturity, and does not value the timing of cash. It shows why the reimbursement amount alone may leave an important part of the picture unexplained.
Add timing and unresolved exposure
Show how long payment takes under a clearly defined method, such as days from accepted submission to payment for paid claims. Pair that measure with unpaid balances and aging. Measuring only completed payments can make performance look better while slow or unresolved claims remain outside the calculation.
Keep denial patterns, older receivables, and unresolved reimbursement differences visible. If these measures overlap, do not total them as independent lost revenue.
Use the report card to prioritize a decision
The next step may be to validate a fee schedule, investigate a repeated denial category, improve an internal workflow, or equip the practice's contracting advisors with a better-supported question. The report card itself does not establish that a contract should be changed or terminated.
For each priority, document the supporting records, the uncertainty, the accountable owner, and the next review date. At the following meeting, distinguish an explanation obtained, a correction submitted, a process changed, and money actually received.
That discipline keeps the conversation useful for both leadership and the billing team. It also makes progress visible when an issue takes more than one reporting cycle to resolve.
Bring payer detail into the executive review
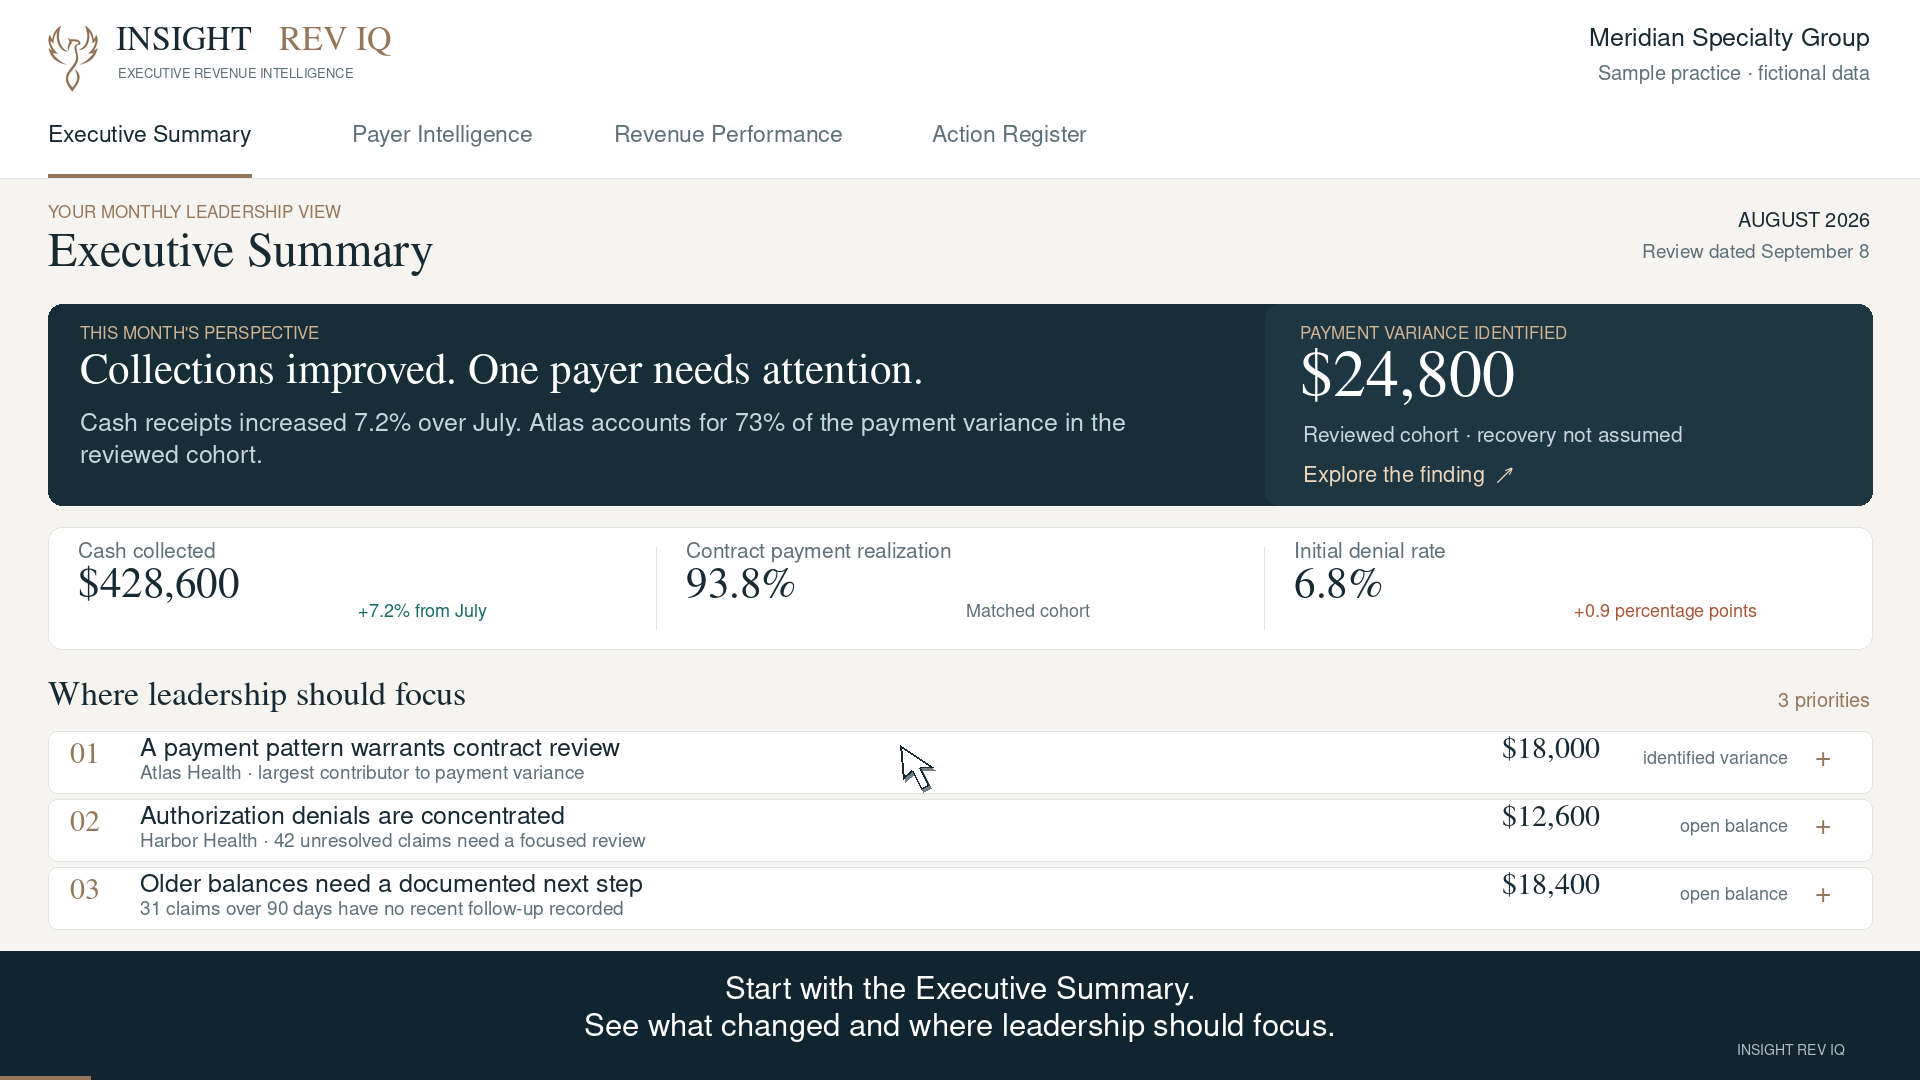
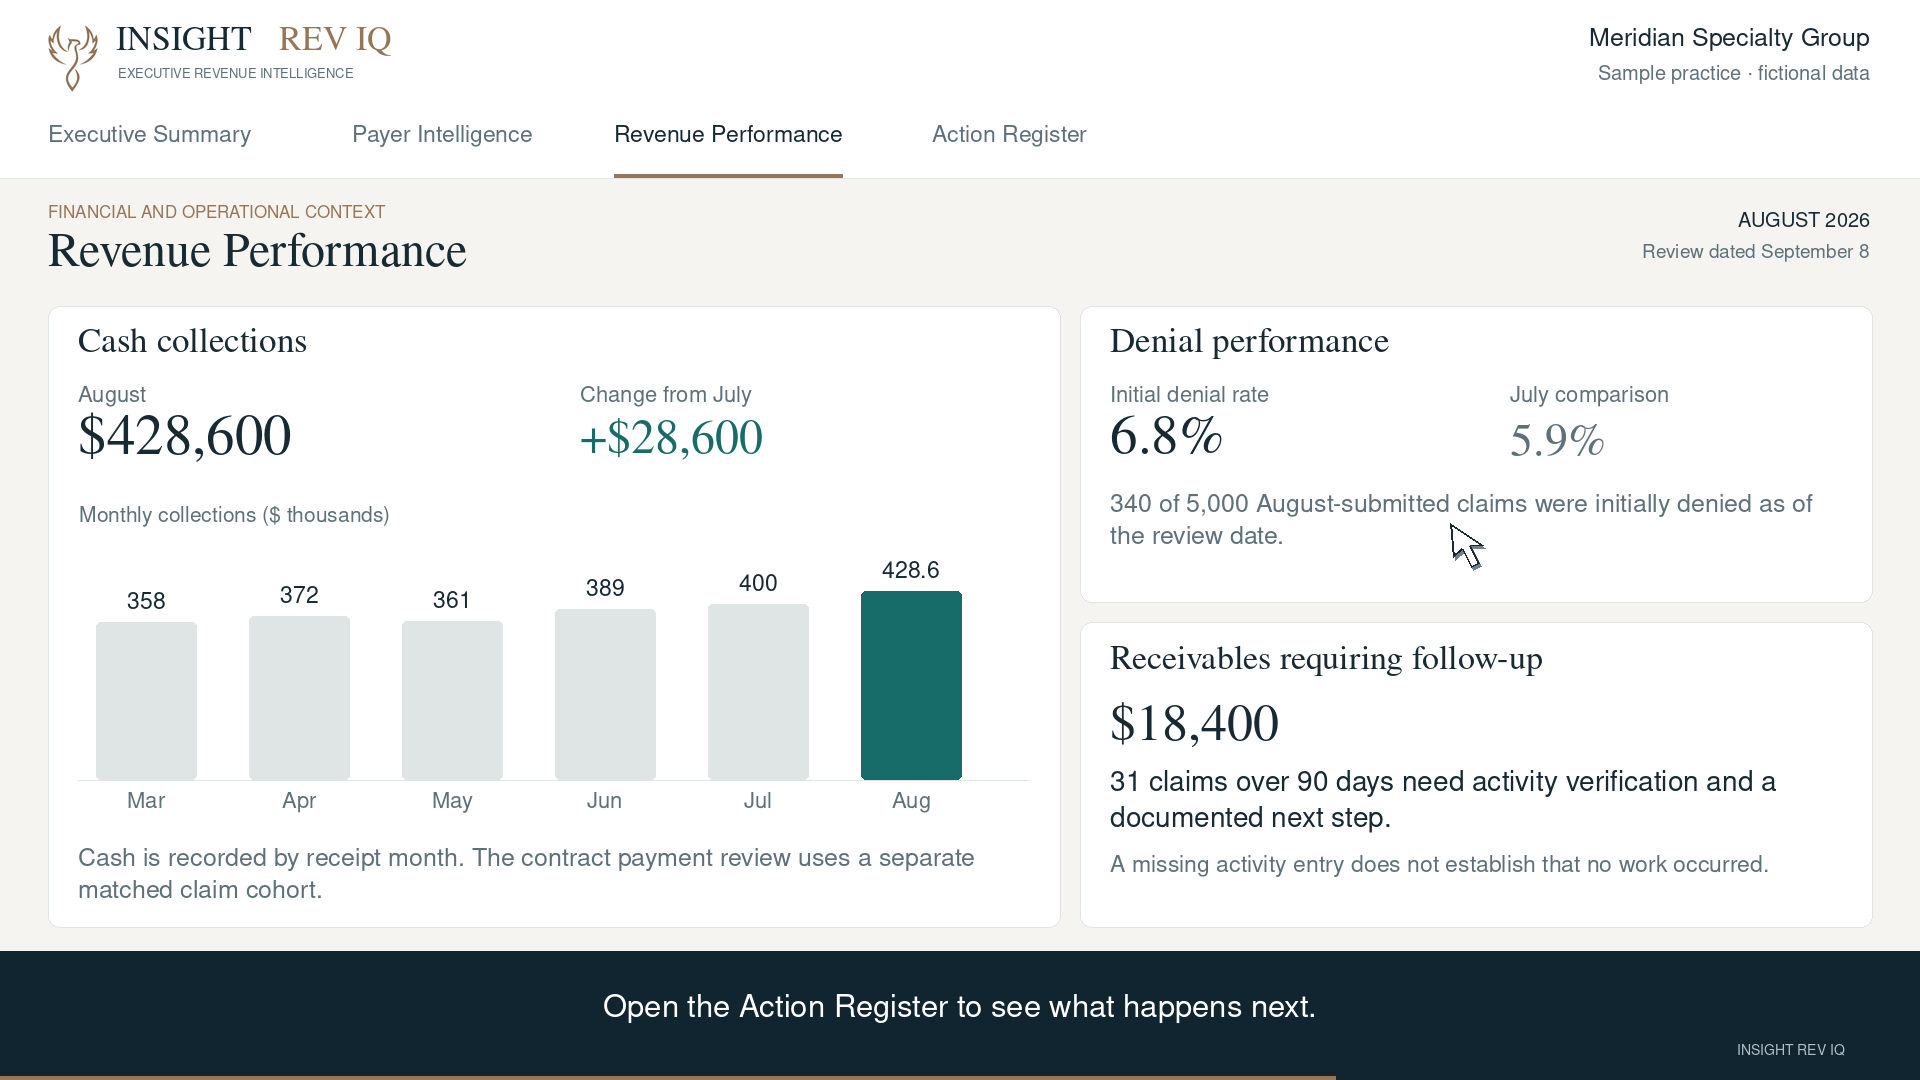
Insight Rev IQ's Executive Revenue Intelligence combines payer scorecards with broader revenue performance and human interpretation. The aim is to help physician owners decide where attention belongs and follow through with the responsible team.
Watch the sample dashboard walkthrough to see how payer findings connect with leadership priorities, or begin the Revenue Performance Insight Review.
-min.webp)


.svg)
