
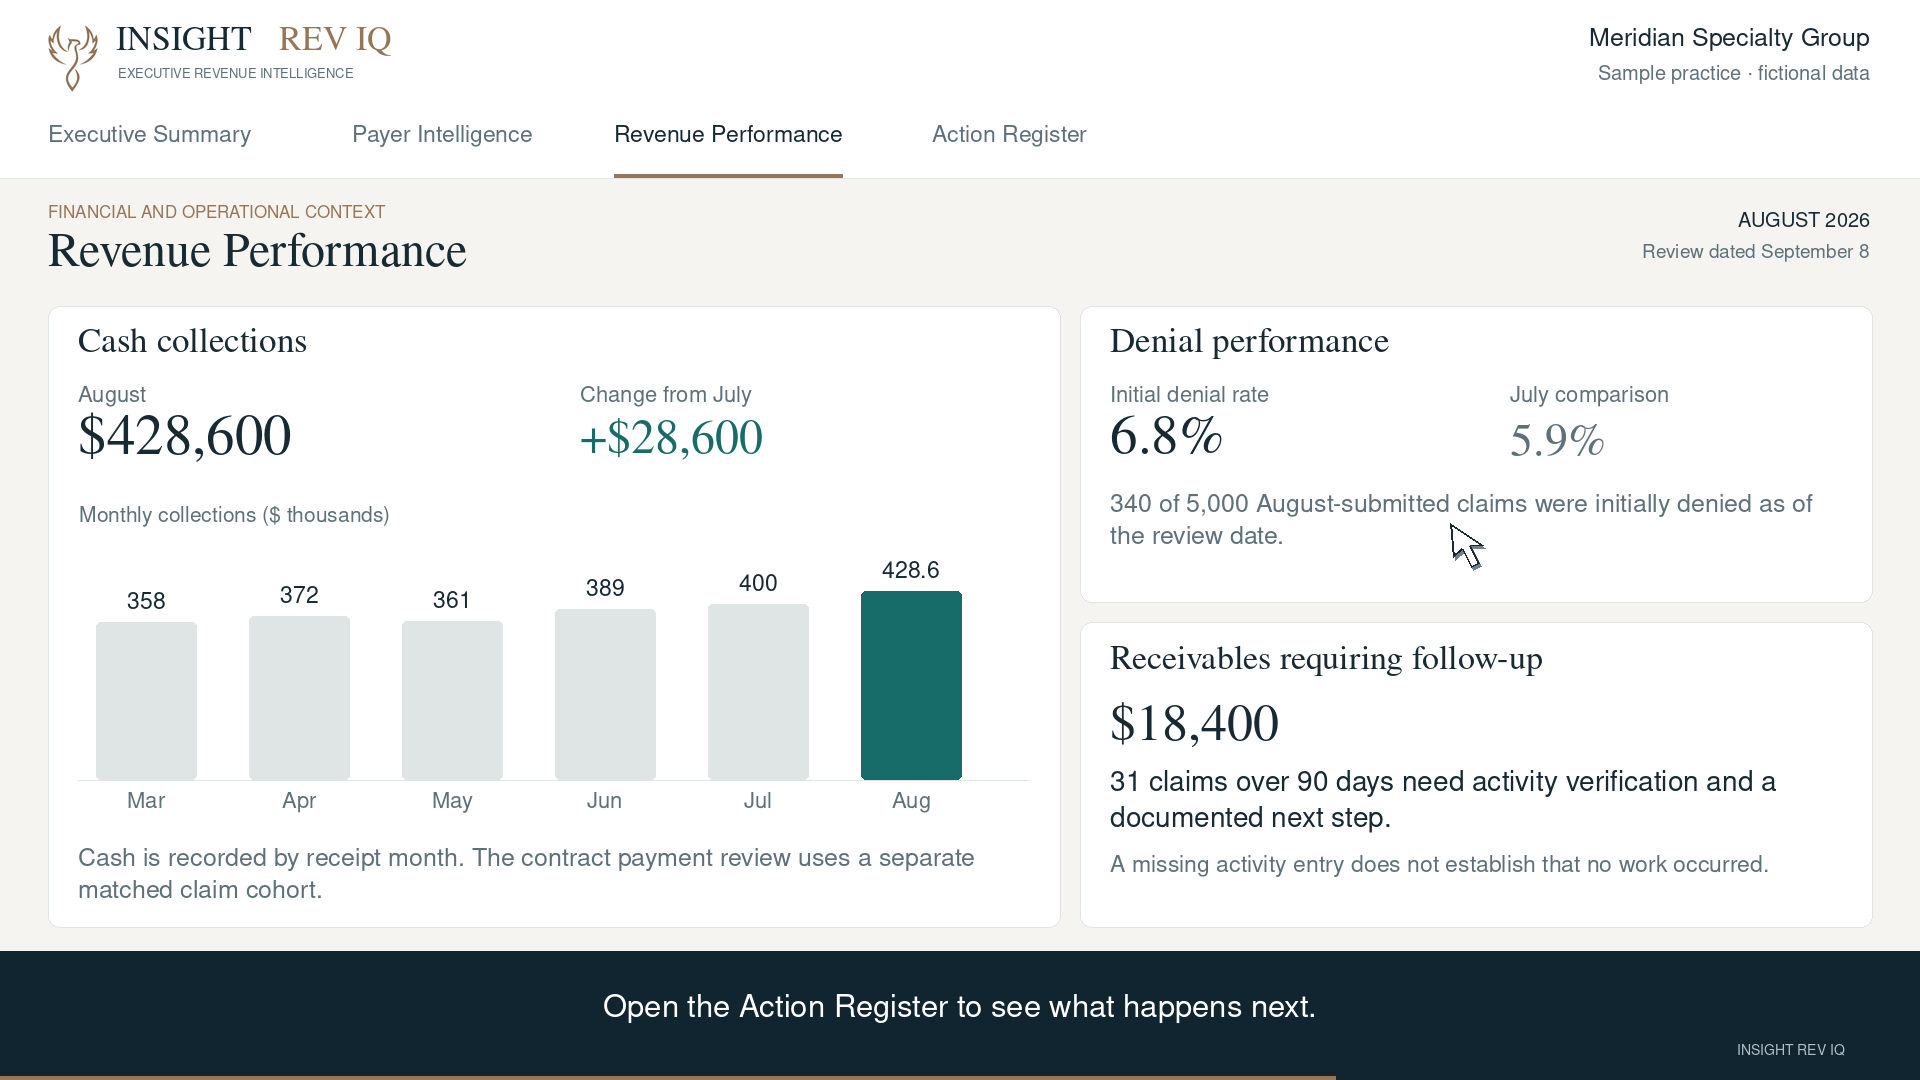
Days in accounts receivable gives physician owners a useful starting point for understanding how much money remains outstanding relative to the practice's billing activity. It does not tell you which claims need attention, whether a balance is collectible, or whether cash improved.
The number belongs on a revenue scorecard. The explanation behind it belongs in the leadership conversation.
How to calculate days in AR
Days in AR = outstanding accounts receivable ÷ average daily charges. Calculate average daily charges by dividing charges in the selected period by the number of days in that period. The AAFP describes this approach in its practice-finance guidance.
For a fictional practice with $450,000 in receivables and $900,000 in charges over 90 days, average daily charges are $10,000. Days in AR are therefore 45. This illustrates the calculation; it is not a performance target.
Label the report with the AR snapshot date, the charge window, and the balance categories included. State whether credit balances are excluded and whether the analysis uses gross charges or an adjusted basis. Do not compare a gross-charge calculation with a net-revenue calculation as if they were the same measure.
A lower number does not always mean faster payment
Suppose the fictional practice still has $450,000 outstanding, but average daily charges rise to $12,000. Reported days in AR fall to 37.5. No additional cash is required for that arithmetic improvement; the denominator increased.
The reverse can happen when a provider takes time away, a location reduces its schedule, or service volume falls. Days in AR can rise even when the team follows up at the same pace. Review charge volume and service mix before assigning a cause.
Write-offs can also reduce receivables without producing cash. If AR falls by $50,000, leadership should know how much came from payments, adjustments, transfers, or other changes. A cleaner aging report and a healthier bank balance are different outcomes.
Separate total AR from the balances that need action
Pair days in AR with an aging view by payer and patient responsibility. Show the dollars in each age band, the share beyond the practice's chosen threshold, and the movement since the prior review. Use a consistent aging date convention; service-date aging and submission-date aging answer different questions.
Then identify the balances behind the change. A rise in older AR could reflect unresolved denials, missing documentation, payment-posting issues, payer processing delays, or patient balances. These are investigation paths, not conclusions the metric establishes.
Ask the team to separate claims awaiting a normal next step from accounts with an unresolved barrier. A large balance with no recent action needs a different conversation from a documented appeal awaiting a response.
Use a trend before choosing a target
There is no single days-in-AR number that explains every specialty, payer mix, and reporting system. Begin with the practice's own consistent history and examine what changed. If you use an external benchmark, confirm the underlying definition and whether the comparison group resembles your practice.
A useful monthly review includes the current result, several prior periods, charge volume, cash receipts, and older balances. That context makes it easier to tell whether a change reflects payment timing, business volume, reporting definitions, or work that needs intervention.
Five questions for the monthly review
- Did the balance decline because cash arrived or because adjustments removed it?
- Did daily charges change enough to explain the trend?
- Which payers and balance categories account for the oldest receivables?
- What is preventing the next action on those balances?
- Who owns the next step, and when will leadership see an update?
Turn the answers into an action register. For example: the billing lead reviews a defined set of aging claims, the practice manager obtains missing documentation, and the next meeting checks whether payment or another documented outcome occurred. Keep potential opportunity separate from confirmed collections.
Read days in AR alongside collection performance
Days in AR describes the outstanding balance relative to activity. Net collection rate examines collections against a defined collectible amount. Denial rate highlights payment obstacles. None replaces the others.
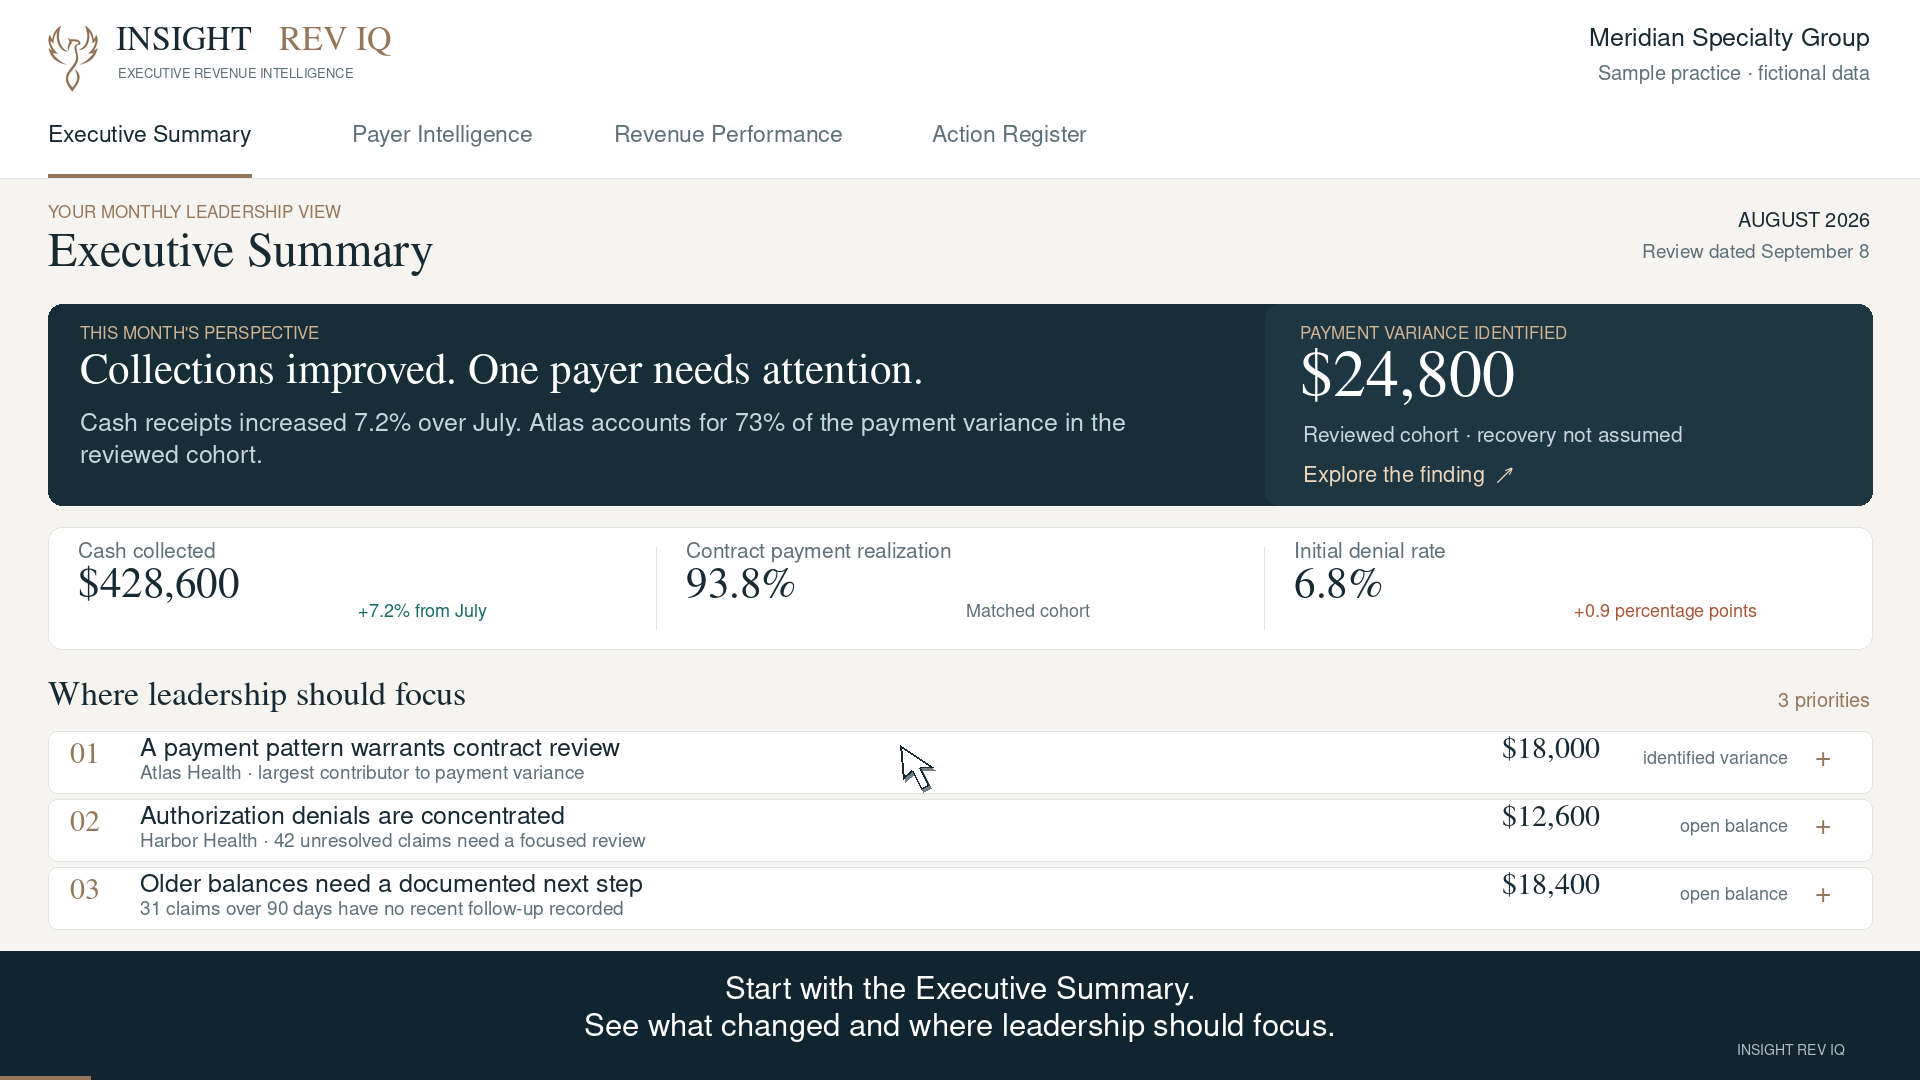
Insight Rev IQ combines these measures with payer detail and human interpretation through Executive Revenue Intelligence. If your reports show the number but leave the next step unclear, start the Revenue Performance Insight Review.
-min.webp)


.svg)
